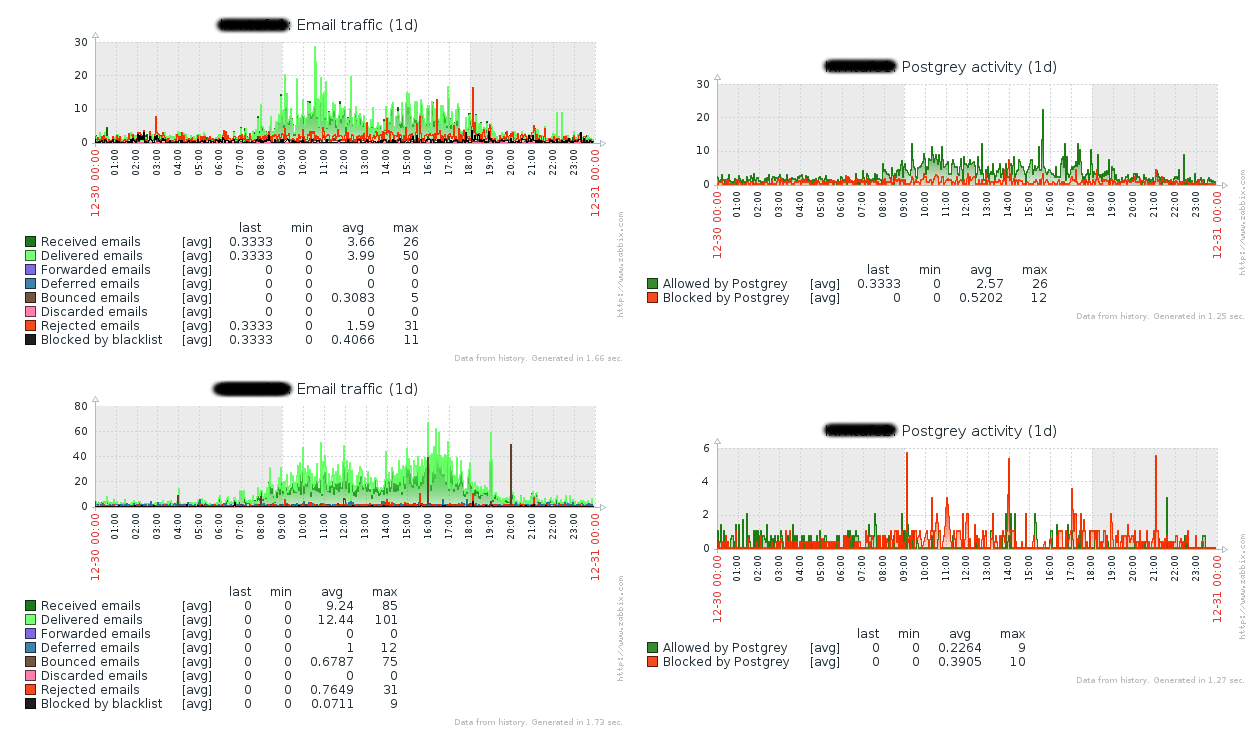
Today’s Zabbix templates are for Postfix and Postgrey (but separated in case you don’t use both).
Since I run a moderate volume set of email servers, I could probably have Zabbix request the data and parse the logs all the time, but why not do it in a way that could scale better? (yes, I know I have 3 greps that could be replaced by a single awk call, I just noticed it and will improve it in the future).
I took as base a few other examples and improved a bit upon them resulting in the following:
- A cron job selects the last entries of /var/log/maillog since the previous run (uses logtail from package logcheck in EPEL)
- Then pflogsumm is run on it as well as other queries gathering info not collected by pflogsumm (in my case, postgrey activity, rbl blocks, size of mail queue)
- Then zabbix_send is used to send the data to the monitoring server
The cron job gets the delta t you want to parse the logs, in my case it’s -1 as I’m going it per minute and that’s an argument to find … -mmin and you’d place it like this:
* * * * * /usr/local/bin/pfstats.sh -1
This setup will very likely require some adaptation to your particular environment, but I hope it’s useful to you.
Then you can make a screen combining the graphics from both templates as the following example:

